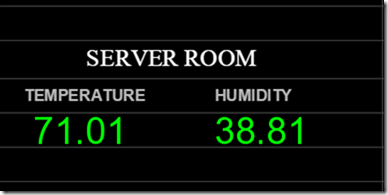
If you want to monitor the temperature and humidity level of your server room with Nagios then there is a plugin for that. I personally don’t go to the server room regularly so I wouldn’t know if the AC failed in that room until probably its too late, so getting automatic alerts when the room gets too hot or too cold is a good idea. In this tutorial I will guide you step by step on how to setup a temperature sensor in your server room , and set Nagios to notify you when the temperature or humidity level is too high or too low in the room.
Setting up the sensor
The first thing you need to do is get the sensor. I bought our sensor from here http://eesensors.com/server-room-temperature-monitoring.html we bought two, and both were shipped quickly, so they are fast!! You will need to setup the sensor with a static IP address when it arrives, in the package you will find detailed instructions how to do it, so getting it up and running is quick and simple. After you have the sensor setup with its own static IP address, you will be able to login to the device by typing in the IP address on the browser
Setting up Nagios
Now, that the sensor is setup, its time to setup the Nagios plugin. Download the plugin from this URL and extract it. Upload the check_em01.pl to your Nagios plugin directory /usr/local/nagios/libexec and using terminal make the file executable using this command chmod x+ check_em01.pl inside the folder you downloaded there is a Perl folder, inside that folder you will find this file checkcommands.cfg open it and copy and paste its contents to your Nagios commands.cfg file:
# 'check_temp' command definition
define command{
	command_name check_temp
	command_line $USER1$/check_em01.pl --type=temp --temp=$ARG1$,$ARG2$ $HOSTADDRESS$
	}

# 'check_humidity' command definition
define command{
	command_name check_humidity
	command_line $USER1$/check_em01.pl --type=hum --hum=$ARG1$,$ARG2$ $HOSTADDRESS$
	}
Now setup the
# 'check_light command definition
define command{
	command_name check_light
	command_line $USER1$/check_em01.pl --type=illum --illum=$ARG1$,$ARG2$ $HOSTADDRESS$
	}
Then setup the host and check up services. mine look like this:
define host{
        use                     websensor-host            ; Name of host template to use
        host_name               websensor
        alias                   websensor
        address                 192.168.x.x
                contact_groups                  admins ;
        }


define service{
        use                             websensor-service         ; Name of service template to use
        host_name                       websensor
        service_description             EM01 Websensor Temperature
        check_command           check_temperature!20!80!10!88
        }

define service{
        use                                             websensor-service         ; Name of service template to use
        host_name                                       websensor
        service_description                            EM01 Websensor Humidity
        check_command                                   check_humidity!10!90!5!95
        }
Reload Nagios sudo service nagios reload then after that, the sensor should show up in your Nagios Dashboard like this:
That’s it. you are done!
Was this article helpful?
Your feedback helps us improve our content.
9 people found this helpful!


